
DSP Graph is a web based tool that allows users to write and run JavaScript code directly in their web browser.
Note: DSP Graph is not intended for end-users, and is instead designed for audio software developers and people who want to learn about building audio software. If you are not an audio software developer or are not interested in building audio software, this tool may not be suitable for your needs.
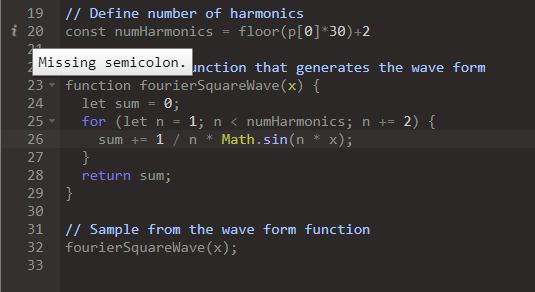
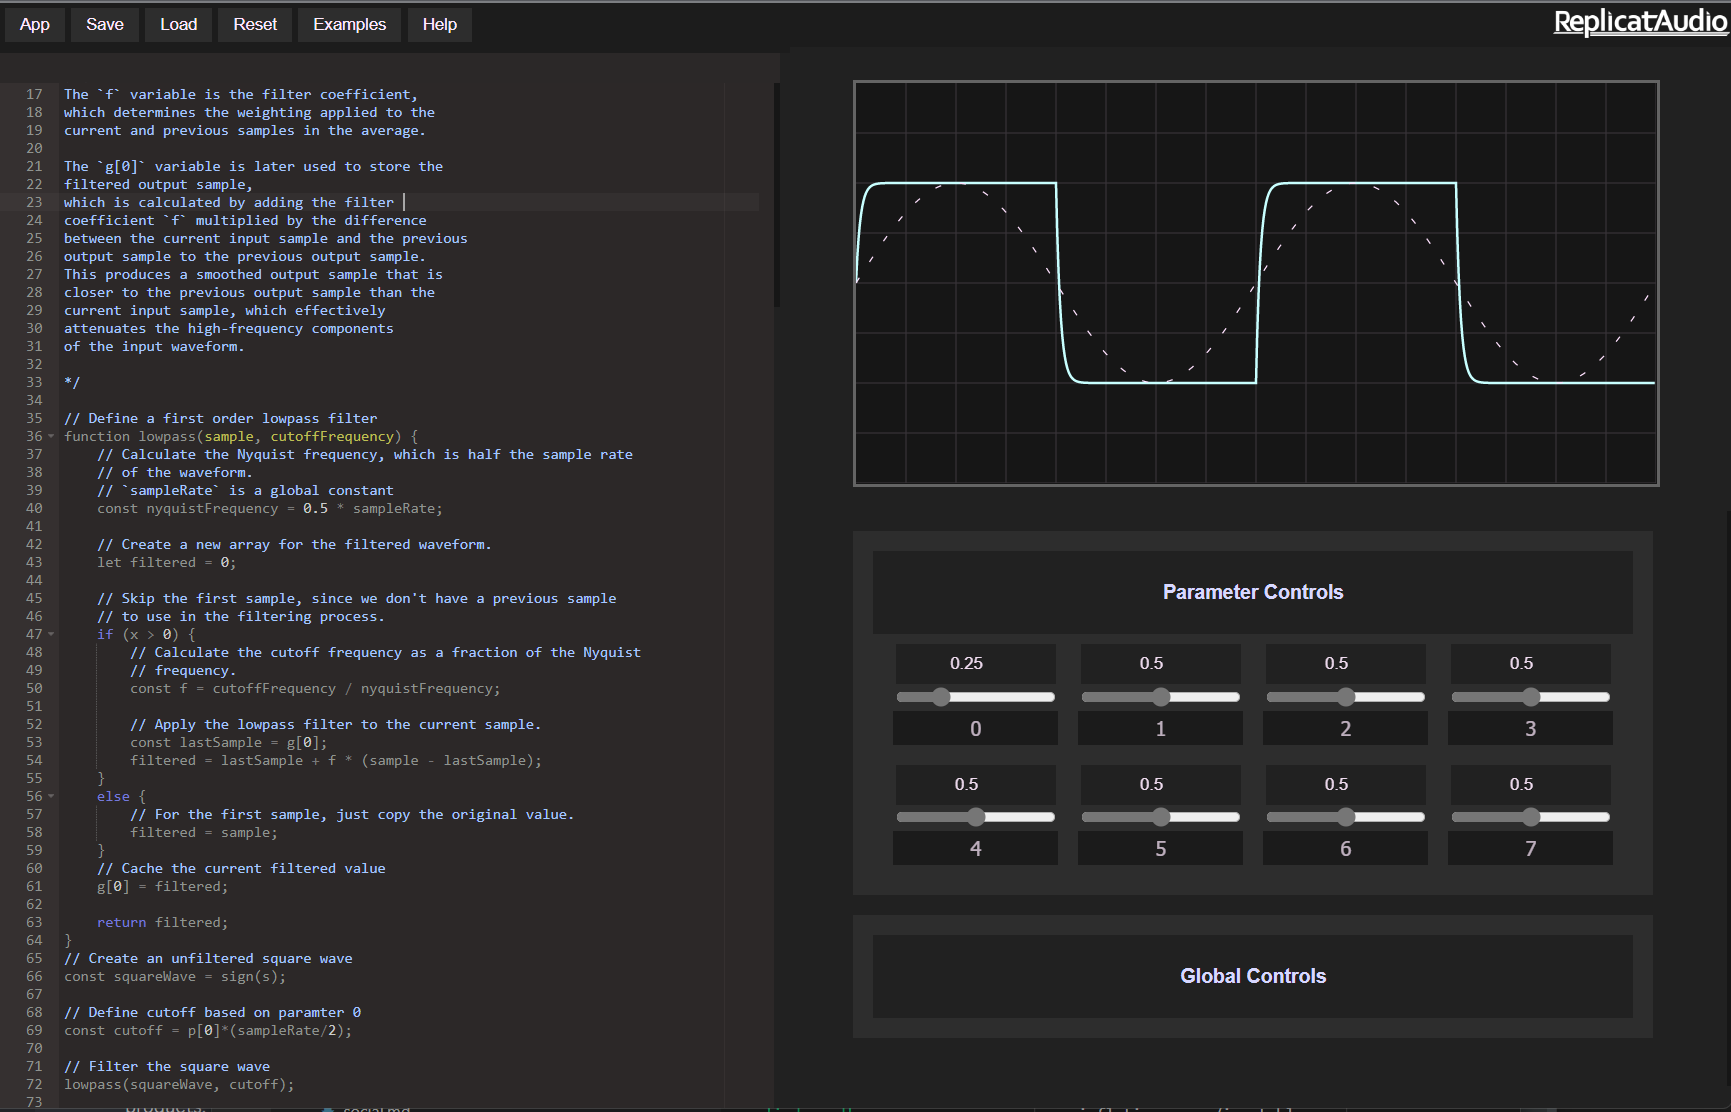
This graphing tool is specifically designed for digital audio signal processing, and features a simple, intuitive interface that makes it easy for users to enter and edit their code. The built-in graph generator can be used to visualize the output of the code in real time, providing a useful tool for experimenting with different algorithms and techniques for digital audio signal processing.
DSP Graph is a valuable resource for anyone working in the field of digital audio signal processing, or for anyone interested in learning more about this important area of computer science.
DSP Graph is different from Desmos in several key ways. First, while Desmos is focused on general purpose graphing and exploration of mathematical concepts, DSP Graph is specifically designed for digital audio signal processing. This means that DSP Graph includes features and tools that are tailored to working with discrete math and audio buffers, which can be difficult to work with in a general purpose graphing calculator.

Additionally, DSP Graph allows users to write code that is closer to the C++ used in audio development, whereas Desmos is focused on pure math. This makes DSP Graph a more specialized and powerful tool for audio software developers and others who are interested in working with digital audio signal processing.
DSP Graph includes many examples of common digital signal processing algorithms, which are provided to help users get started with the tool and to provide a reference for common techniques and approaches. The examples include a wide range of algorithms, from basic filtering techniques to more advanced techniques for working with audio data.

These examples can provide a starting point for your own code, and by giving you better understanding of how different DSP algorithms work and how they can be applied in practice. The examples can also serve as a valuable reference for users who are new to the field of DSP, helping them to learn more about the different techniques and approaches that are commonly used in this area.
Please note that DSP Graph was not written by an Electronics Engineer, and that the examples provided with the tool may contain errors or inaccuracies. The software is open source, and contributions and corrections from the community are welcome. If you are an Electronics Engineer or have expertise in digital signal processing, we encourage you to review the examples and to submit any corrections or improvements that you may have. Your contributions will help to improve the accuracy and usefulness of the tool, and will be greatly appreciated by the community of users who rely on DSP Graph for their digital signal processing needs.
Check it out on GitHub!